Labs: Demand These 4 Data Points for GLP-1 Peptide Purity
Written by Jian Wang, Founder & CEO · · Updated
Before you run a single experiment with a GLP-1 analog, you need four things in hand: an HPLC chromatogram showing a main peak at or above the research-grade purity standard, a mass spec result matching the expected mass within tolerance, a net peptide content assay, and an endotoxin result scaled to your assay type. If a vendor can’t produce all four, tied to that specific lot, don’t use the material. A purity percentage without MS confirmation and lot-specific documentation isn’t verification; it’s a marketing claim.
TL;DR:
- Purity assessment must include HPLC purity, MS confirmation, net peptide content, and endotoxin levels scaled to usage; lacking any of these invalidates the lot.
- HPLC purity alone does not guarantee correct identity, especially for acylated GLP-1 analogs, which require orthogonal methods like MS and advanced chromatography.
- Proper analytical methods depend on detailed parameters and raw data accessibility; generic “tested by HPLC” claims are insufficient for verification.
- Separating acylated variants from impurities demands tailored gradient profiles, specific column chemistries, and multiple orthogonal techniques, often including spectral peak purity analysis.
- Relying solely on the vendor’s COA without independent verification or detailed raw data risks accepting contaminated or mislabeled peptides that could impair research outcomes.
Table of Contents
- What GLP-1 Peptide Purity Actually Measures
- Reading HPLC and Mass Spec Data for GLP-1 Analogs
- Separating Acylated Variants: Method Development That Actually Works
- Validating Potency and Stability Assays for GLP-1 Peptides
- What a Complete Certificate of Analysis Should Contain
- Storage, Handling, and Catching Degradation Before It Wrecks Your Data
- Why Independent Lab Verification Changes the Procurement Equation
- The Mistake Most Labs Make With Purity Data
- Get Vendor Data Before You Order, Not After
- Primary Sources Worth Bookmarking
- Sources
- FAQ
What GLP-1 Peptide Purity Actually Measures
“Purity” gets thrown around as if it’s one number, but for GLP-1 analogs like semaglutide, tirzepatide, and retatrutide, it’s really three separate measurements that each catch different failures.
HPLC purity (area percent) tells you what fraction of the detected material elutes as your main peak versus side peaks. It’s a measure of homogeneity, not identity. A sample can show 99% HPLC purity and still be the wrong molecule entirely, or the correctly-sequenced peptide with the acyl chain attached to the wrong residue.
Mass spec identity confirms the molecule is what the label says. For acylated GLP-1s, this matters more than for a standard peptide because the fatty acid or diacid side chain adds significant mass and can attach at unintended sites. A compound can pass HPLC as a single sharp peak while carrying a conjugation error MS would catch immediately.
Net peptide content measures the actual peptide mass in the vial after accounting for water, salts, counter-ions, and residual solvents from lyophilization. This is the number that matters for dosing accuracy. A vial listing 5 mg of lyophilized powder might contain closer to 3.8 mg of active peptide once you subtract everything else, and that gap changes every concentration calculation downstream.
Endotoxin rounds out the panel, and its relevance depends entirely on what you’re doing with the material. Cell-based functional assays are far more sensitive to endotoxin contamination than a straightforward binding assay, so the acceptance limit should track the assay, not a generic cutoff.
The failure modes specific to acylated GLP-1 peptides deserve their own attention:
- Non-acylated backbone — the peptide synthesized correctly but missing its fatty acid or diacid chain entirely, which changes its pharmacokinetic behavior completely.
- Partial or mis-site conjugation — the lipid chain attached to the wrong lysine or amino acid position.
- Truncations — shorter sequences from incomplete coupling during solid-phase synthesis, common in longer analogs like tirzepatide’s 39 residues.
- Oxidized variants — methionine or tryptophan residues oxidized during storage or synthesis, shifting mass and often activity.
- Epimerization — a stereochemistry flip at a chiral center that HPLC sometimes resolves and sometimes doesn’t, depending on the column.
Each of these can sit underneath a deceptively clean-looking HPLC trace. That’s the core reason FDA’s guidance on highly purified synthetic peptide drug products treats analytical characterization as a multi-method requirement, not a single pass/fail test. A regulator reviewing a peptide drug substance wants orthogonal confirmation, and a research lab evaluating a vendor lot should apply the same logic.
Reading HPLC and Mass Spec Data for GLP-1 Analogs
Ask a vendor for their method, not just their number. “98% pure” means very little without the column, gradient, mobile phase, and detection wavelength attached to it, because two labs running the same sample on different RP-HPLC setups can report meaningfully different area percentages.
What a proper HPLC setup looks like
Most labs running GLP-1 analogs use C4, C8, or C18 reversed-phase columns, with the choice driven by peptide hydrophobicity. The acyl chain on semaglutide or tirzepatide makes these molecules considerably more hydrophobic than a bare peptide backbone, so C4 or C8 phases often resolve the acylated species from non-acylated impurities better than a standard C18. Detection typically runs at 214 nm, which picks up the peptide backbone’s amide bond absorbance, though some labs add a 280 nm channel if aromatic residues are present in meaningful numbers.
Gradient windows for these analogs commonly run acetonitrile or methanol against a water/trifluoroacetic acid buffer, ramping over 20 to 40 minutes depending on how closely related the impurities are to the main compound. A gradient that’s too steep will bury a partial-ablation impurity under the main peak. A gradient that’s too shallow wastes run time without improving resolution.
Reading the chromatogram itself
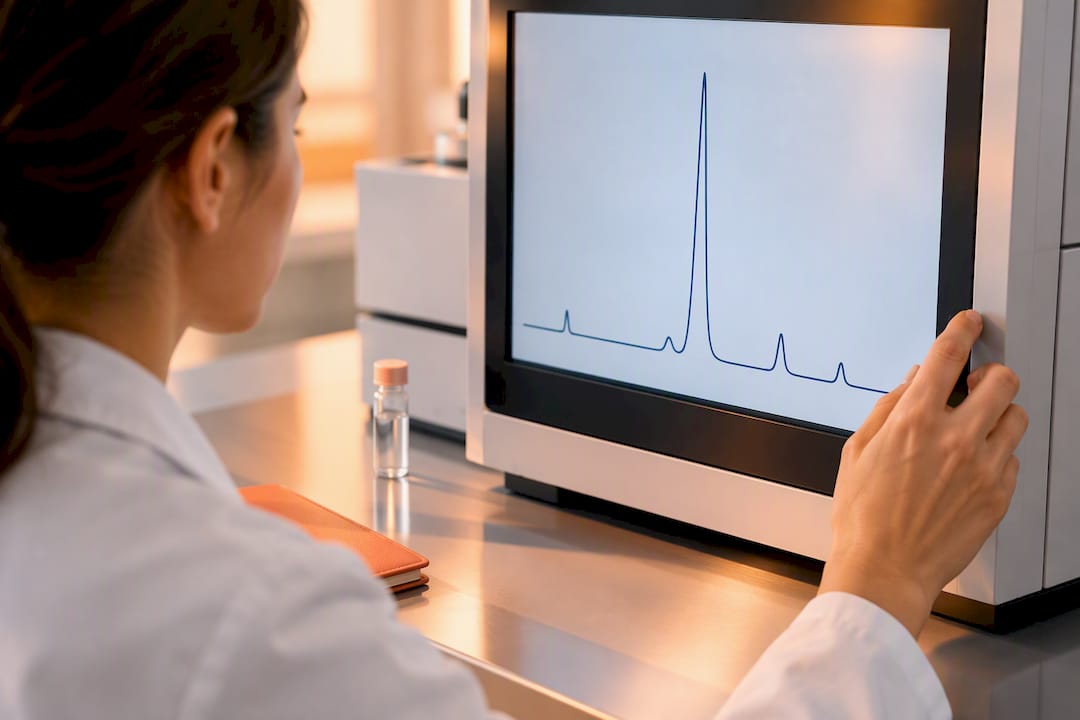
A clean result shows one symmetric, sharp main peak with baseline separation from anything else in the trace. Integration errors are the quiet killer here: software that draws baselines incorrectly under a tailing peak can make a 95% purity sample look like 98% on paper. Always ask whether integration was manual or automatic, and whether the raw chromatogram (not just the summary number) is available for review.
Mass spec identity confirmation
For mass spec, the question is simple: does the observed mass match the expected mass for that specific analog within an acceptable window? On standard LC-MS instruments, a tolerance of ±0.5 to 1 Da is typical. High-resolution instruments tighten that to under 5 ppm. Multiply charged ion envelopes are standard for peptides this size, since a 4,000 Da molecule rarely ionizes as a single charge state, and a competent lab report deconvolutes those charge states into a single reconstructed mass rather than leaving you to interpret a raw spectrum with six overlapping peaks. Published peer-reviewed methods consistently pair RP-HPLC with MS confirmation specifically because HPLC alone cannot distinguish a correctly acylated peptide from certain structurally similar variants that happen to co-elute.
| Parameter | Research-grade benchmark |
|---|---|
| HPLC main peak purity | ≥98% area percent |
| Individual impurity flag threshold | >0.5–1% |
| MS mass tolerance (standard instruments) | ±0.5–1 Da |
| MS mass tolerance (high-resolution) | <5 ppm |
| Endotoxin limit | Assay-dependent; tighter for cell-based work |
Pro Tip: Never accept a summary table with just a purity number and no attached chromatogram image. A number without the trace behind it can’t be independently checked for integration errors, and it’s the single most common way inflated purity claims slip past a busy lab.
Separating Acylated Variants: Method Development That Actually Works
Acylated GLP-1 analogs are notoriously hard to separate cleanly from their own synthesis byproducts, because the impurities often differ from the target molecule by nothing more than the presence or position of a single fatty acid chain. That’s a small structural difference producing a small retention-time difference, which is exactly the kind of gap a poorly tuned method will miss.
- Start column selection with hydrophobicity in mind. C4 and C8 phases tend to separate acylated from non-acylated species more reliably than C18 for these specific molecules, since the acyl chain dominates retention behavior on more retentive phases. Application-note work from instrument vendors confirms column chemistry and gradient shape materially shift how well these variants resolve.
- Flatten the gradient around the elution window of interest. A shallow, extended gradient right where the main peak and its closest impurity elute buys separation that a fast linear ramp simply can’t deliver.
- Try a phenyl-hexyl phase when C4/C8 still shows co-elution. Phenyl selectivity interacts differently with aromatic and aliphatic side chains, and it sometimes resolves pairs that reversed-phase alone can’t touch.
- Run an orthogonal method before finalizing a purity claim. HILIC or ion-exchange chromatography separates based on different physicochemical properties than RP-HPLC, so a peak that looks pure on one system gets a second, independent check on the other.
- Use diode-array detection and peak-purity software, not a single wavelength. DAD lets you compare UV spectra across a peak’s rising and falling edges; a spectral mismatch across the peak is a strong sign of hidden co-elution even when the trace looks like one clean spike.
When separation problems show up, they tend to fall into a short list of recognizable patterns: a broad, low peak usually points to column overload or a degraded stationary phase; a shoulder on the main peak usually means an unconjugated or partially conjugated variant sitting just underneath it; and a peak that shifts retention time between runs on the same column usually means the mobile phase pH or buffer strength isn’t controlled tightly enough. Technical reviews of GLP-1 analytical challenges repeatedly point back to the same lesson: a single chromatographic method is rarely enough to rule out every relevant impurity in this compound class.
Validating Potency and Stability Assays for GLP-1 Peptides
Purity data tells you what’s in the vial. Potency and stability testing tell you whether that material still behaves the way it’s supposed to, and the two questions require different assay designs entirely.
Choosing between a binding assay and a functional assay depends on what you’re actually trying to learn. A receptor binding assay measures affinity but says nothing about downstream signaling, while a functional assay (typically cAMP accumulation for GLP-1 receptor agonists) captures actual biological activity. Impurities skew both, but they skew functional assays harder, since a truncated or non-acylated species can still bind the receptor at reduced affinity while contributing almost nothing to the functional signal, flattening your dose-response curve in a way that’s easy to misattribute to the wrong cause.
Validation itself should follow the framework laid out in ICH Q2(R1), which covers accuracy, precision, specificity, linearity, range, and robustness. For a peptide potency assay specifically, that translates into a practical checklist:
- Specificity confirmed against known degradation products, not just a blank matrix.
- Precision demonstrated across multiple analysts or runs, not a single operator’s data.
- Linearity established across the concentration range you actually plan to use experimentally.
- Robustness checked against small, realistic variations in reagent lot or incubation time.
Stress studies are the practical way to generate a stability-indicating method rather than just claim one. Expose a sample to heat, light, or agitation, run it on your HPLC method, and confirm new degradation peaks actually separate from the main peak rather than hiding under it. If your method can’t resolve a heat-stressed sample from an untreated one, it isn’t stability-indicating yet, regardless of what the validation report says.
Purity thresholds should also scale with the sensitivity of the downstream work.
What a Complete Certificate of Analysis Should Contain
A COA that only lists a purity percentage and a lot number is a marketing sheet, not analytical documentation. A genuinely useful COA includes the HPLC chromatogram itself (not just the integrated area result), the method parameters behind it, the raw MS spectrum with instrument settings, the net peptide content result, endotoxin data, the specific lot number, and the analysis date.
Method parameters matter more than most researchers initially assume. Without the column, gradient, and detection wavelength on record, there’s no way to compare a result from one lot to a result from another, or to reproduce the same analysis independently if a question comes up later. USP’s recent resources for GLP-1 agonist product quality specifically call out reference materials and documented testing approaches as the foundation for meaningful cross-lab comparability, and a COA without method detail simply can’t support that comparison.
A few red flags are worth flagging immediately when you see them in a supplier’s documentation:
- No chromatogram image, just a stated purity number with nothing behind it.
- Vague method language like “tested by HPLC” with no column, gradient, or wavelength specified.
- MS data that isn’t tied to the specific lot in hand, sometimes recycled from an earlier batch entirely.
- A COA date that doesn’t align with the lot number, suggesting the analysis wasn’t run on the material actually shipped.
A buyer’s QC guide from Data Peptides and examples of quality lab reports compiled by Vertex Peptides Lab both walk through what complete documentation looks like in practice, and comparing a supplier’s paperwork against those templates is a fast way to spot what’s missing.
Storage, Handling, and Catching Degradation Before It Wrecks Your Data
GLP-1 peptides degrade primarily through three mechanisms: oxidation of susceptible residues, hydrolysis of peptide bonds under moisture or thermal stress, and aggregation, which shows up as new high-molecular-weight species on HPLC or MS. Light exposure accelerates oxidation. Temperature cycling accelerates all three at once.
- Store lyophilized material cold and dark, following the vendor’s specific temperature guidance, and avoid leaving vials at room temperature longer than necessary during handling.
- Aliquot on first reconstitution. Splitting a stock solution into single-use portions immediately after reconstituting avoids repeated freeze-thaw cycles, which are one of the fastest routes to aggregation in acylated peptides.
- Run a quick verification panel on receipt, before committing a lot to a full experimental series. A visual check for discoloration or particulates, a solubility check in the intended buffer, and a fast HPLC run compared against the supplied chromatogram will catch most shipping or storage failures early.
- Escalate immediately if the receipt-check HPLC doesn’t match the COA. Don’t average it into your data or assume drift; flag the lot, contact the supplier, and hold the material until it’s resolved.
Pro Tip: Run your verification HPLC injection under the exact same method parameters listed on the COA, not your lab’s default method. A different gradient or column will produce a different-looking trace even from an identical, unaltered sample, and that mismatch gets mistaken for degradation more often than it should.
Why Independent Lab Verification Changes the Procurement Equation
A supplier’s own COA is, by definition, self-reported. That doesn’t make it wrong, but it does mean it’s one data point rather than confirmation. Blind, third-party testing on the same lot gives you a second, independent measurement to check the first one against, and batch-level public reporting lets you see how a vendor’s actual shipped material has performed over time rather than trusting a single glossy data sheet.
A practical workflow looks like this:
- Pull the supplier’s COA and note the method parameters, purity figure, and MS identity result.
- Cross-check that data against independently generated results for the same vendor and, where possible, the same lot.
- If the two data sets align, proceed with a standard receipt-check HPLC run as a final confirmation.
- If they diverge meaningfully, request reanalysis from the supplier, submit your own sample for independent testing, or return the lot rather than absorb the risk into your experimental data.
Vendor-specific lab result pages that show batch-level chromatograms alongside a supplier’s own claims make discrepancies visible fast, often within a single side-by-side comparison. That kind of cross-check turns a documentation review from a trust exercise into an actual verification step, which is the whole point of asking for a COA in the first place.
The Mistake Most Labs Make With Purity Data
The biggest mistake I see is treating one purity percentage as the whole story. Prioritize three checks on every new lot: request the raw chromatogram, confirm MS mass against the expected value, and verify net peptide content before calculating any dose. Independent verification isn’t extra diligence anymore. It’s the baseline for trusting anything you build on top of that data.
— Ross
Get Vendor Data Before You Order, Not After
Reading a COA critically only gets you so far when the underlying testing came from the vendor itself. An independent platform offers HPLC and mass spec results across many peptide vendors, updated regularly, so you can compare a supplier’s claims against blind third-party data before a shipment ever reaches your lab.
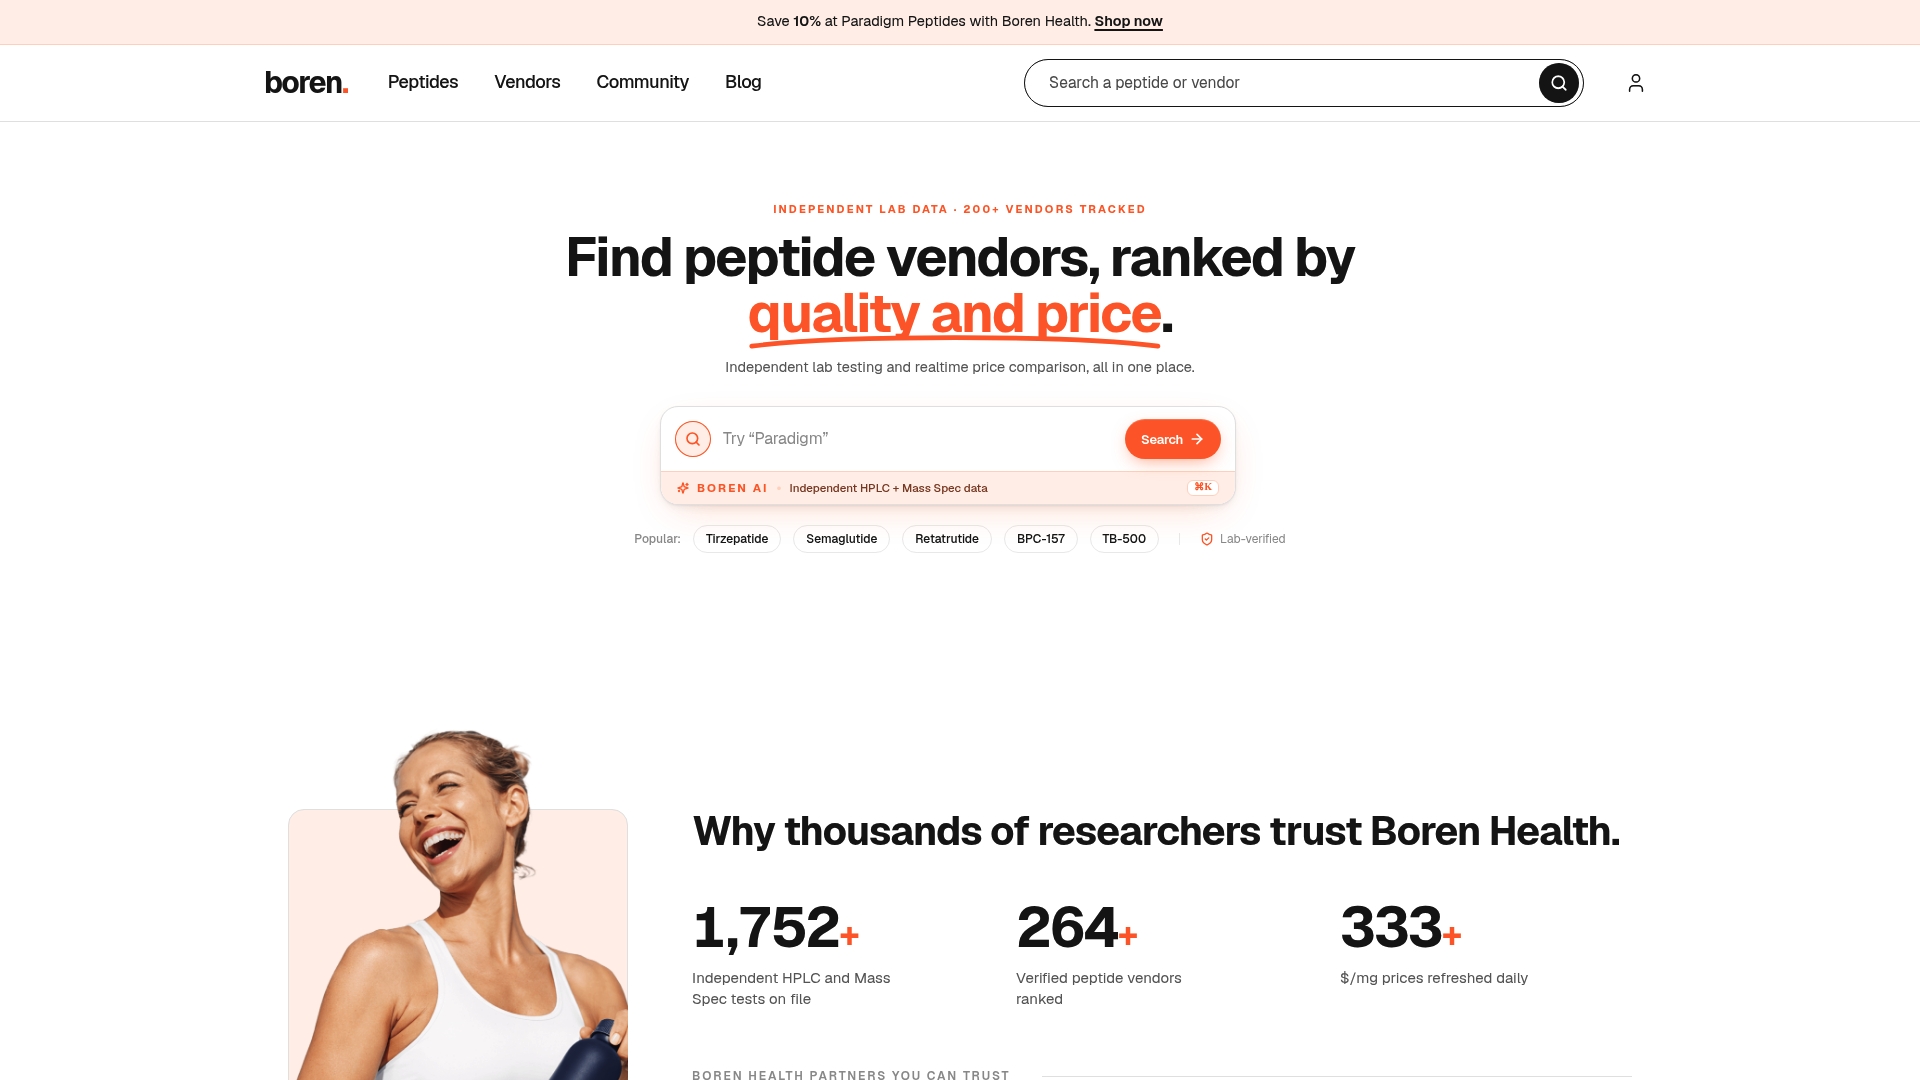
Researchers typically use the platform two ways: browsing lab-verified purity rankings and vendor comparisons before placing an order, or submitting their own received lot for independent confirmation when a COA looks thin or a result seems off. Some published results include failures, not only passing lots, because a comparison tool that only shows winners isn’t actually useful for procurement decisions. If you’ve already got material in hand and the documentation doesn’t answer your questions, submit a sample for independent third-party testing and get lab-verified numbers back rather than relying on paperwork alone.
Primary Sources Worth Bookmarking
For deeper method validation guidance, consult FDA’s peptide drug substance guidance, USP’s GLP-1 quality resources, and peer-reviewed HPLC/MS method literature.
Sources
- FDA guidance: ANDAs for certain highly purified synthetic peptide drug products of rDNA origin
- USP launches resources to support product quality for GLP‑1 agonists
- Peer-reviewed methods and reviews describing HPLC and MS approaches for peptide analysis (representative PubMed reference)
FAQ
Is 98% Purity Good for Peptides?
Studies requiring tighter dose-response precision, such as receptor pharmacology, often push that threshold to 99% or higher because impurity-driven noise compounds faster in sensitive functional assays.
How Can I Tell if My Peptides Are Pure?
Purity requires more than one test: an HPLC chromatogram showing a single sharp main peak, mass spec confirmation that the observed mass matches the expected mass for that specific analog, and ideally a net peptide content result accounting for water and salts. A high HPLC number alone can’t rule out acylation errors or truncations that only mass spec would catch.
Are GLP-1 Drugs Actually Peptides?
Yes. Semaglutide, tirzepatide, and retatrutide are all synthetic peptides, chains of amino acids modified with a fatty acid or diacid side chain that extends how long they stay active in circulation. That acylation is also exactly what makes purity analysis harder, since standard peptide methods don’t always resolve acylation-related impurities without deliberate method development.
Is 2.5 mg of GLP-1 a Lot?
Whether a given milligram amount is large or small depends entirely on the specific peptide, its potency, and the experimental context, since GLP-1 analogs vary widely in molar potency and intended use. Any dosing decision should be based on net peptide content data from the specific lot in hand, not the labeled total weight, since inactive mass from residual solvents and counter-ions can meaningfully change what’s actually active peptide.
What Should I Ask a Vendor For Before Buying a GLP-1 Peptide Lot?
Request the lot-specific COA, the raw HPLC chromatogram with method parameters, the raw MS spectrum, and endotoxin results appropriate to your assay. Cross-checking those against independent data, such as the lab-verified results Peptide Vendor Reviews publishes across vendors, adds a second data point before you commit a lot to a full experimental series.