200+ Vendor Tests Show How Buyers Should Compare 2026 Peptide Prices
Written by Jian Wang, Founder & CEO · · Updated
Research-grade peptide prices are diverging sharply in 2026, not moving uniformly in one direction. GLP-1 class peptides and anything caught in FDA enforcement sweeps carry a scarcity premium, while stable, low-scrutiny peptides are softening as synthesis automation cuts costs. The one move every buyer needs to make now: stop comparing sticker prices and start normalizing every quote to price-per-net-mg, backed by a lot-specific certificate of analysis.
TL;DR:
- Price volatility in GLP-1 peptides is driven by recent enforcement actions and regulatory concerns, with scarcity premiums surfacing during enforcement spikes.
- Vendors’ lot-specific lab verification, including chromatograms and net peptide content, is essential to accurately compare prices and avoid overpaying or testing inaccuracies.
- Automated synthesis and improved purification technologies are lowering baseline manufacturing costs, but enforcement-driven premiums are expected to persist for high-scrutiny peptides.
- Raw material shortages for complex peptides and reagent costs contribute to unpredictable price increases, especially for longer or more complex sequences.
- International trade policies, customs delays, and regional demand imbalances add further variability and risk to peptide pricing and availability.
Table of Contents
- 2026 Market Snapshot: Which Peptide Categories Moved Most
- What’s Actually Driving Peptide Prices This Year
- How to Compare Vendor Prices Without Getting Fooled
- Regulatory Risk in 2026: What Procurement Teams Need to Watch
- Where Peptide Prices Go From Here
- Bulk Orders vs. Small Purchases: Does Scale Actually Save Money
- Raw Material Bottlenecks Are Quietly Pushing Costs Up
- Automated Synthesis and Purification Are Reshaping the Cost Curve
- Global Demand and Trade Policy Are Adding a New Layer of Price Risk
- From Order to Delivery: What Actually Takes Time and Money
- Peptide Vendor Reviews’s Take on Why Lab Data Changes the Price Conversation
- How to Act Now: Normalize Prices and Verify Purity Before You Buy
- Sources
- FAQ
2026 Market Snapshot: Which Peptide Categories Moved Most
Vendor-level pricing data through 2026 shows a split market rather than a single trend line. GLP-1 class research peptides, tirzepatide analogs, and other compounds tied to weight management research have seen the most price volatility, with quotes swinging based on how recently a vendor’s supply chain got flagged in enforcement activity. Meanwhile, legacy research peptides with stable supply chains and long safety track records have trended flatter or even softer, as more manufacturers compete for that volume and automated synthesis lowers marginal cost.
The volatility in GLP-class peptides isn’t happening in a vacuum. The FDA has flagged serious concerns about unapproved GLP-1 drugs sold outside approved channels, reporting hundreds of adverse events tied to compounded and gray-market semaglutide and tirzepatide products. That kind of regulatory attention doesn’t just create legal risk for vendors. It shrinks the pool of suppliers willing to sell those peptides at all, and the ones who remain price in a risk premium.
Here’s where the pressure is concentrated right now:
- GLP-1 class and tirzepatide-class peptides: highest price volatility, often tied to enforcement timing rather than raw material cost.
- Investigational and novelty peptides: thin supply, few vetted vendors, prices set almost entirely by scarcity.
- Established research peptides (stable safety and synthesis history): flat to softening prices as competition and yield improvements bring costs down.
- Peptides bundled with delivery supplies (bacteriostatic water, dosing calculators): increasingly hard to source at all as vendors pull them to avoid scrutiny.
Statistic Callout: The FDA’s own count of adverse events linked to unapproved GLP-1 products, reported in the hundreds, is a big part of why enforcement in this category has intensified. Every enforcement action tightens supply for that peptide class, and tighter supply shows up in vendor quotes within weeks.
What’s Actually Driving Peptide Prices This Year
Four forces explain most of the 2026 price movement, and understanding them helps you read a vendor quote instead of just reacting to it.
Manufacturing and purification costs sit at the base of every quote. Resin costs, coupling reagent prices, and the purification yield a manufacturer achieves all feed into per-mg cost, and salt form choice (acetate versus TFA) changes both cost and the net peptide content you actually receive.
Analytical and quality control overhead has grown as buyers demand more proof. Running HPLC and LC-MS confirmation on every lot costs real money, and vendors who invest in third-party testing pass that cost forward. Cutting corners here is exactly how mislabeled or impure lots reach buyers.
Regulatory enforcement creates what amounts to a risk premium. Warning letters and product seizures don’t just remove bad actors. They spook legitimate suppliers into raising prices or exiting categories altogether, at least temporarily.
Demand-side pressure from expanding clinical interest in certain peptide classes, combined with diversion into unauthorized human use, pulls supply away from legitimate research applications and pushes prices up for everyone still buying for research purposes.
- Resin, reagent, and yield economics set the manufacturing floor.
- HPLC/MS testing and COA generation add real, unavoidable cost.
- Enforcement scarcity adds a temporary but sometimes sharp premium.
- Clinical-adjacent demand pulls supply from research-only channels.
Lot-to-lot variability compounds all of this. Two vials from the same vendor, months apart, can carry different net peptide content even under the same label, which is exactly why per-lot verification matters more than a vendor’s general reputation.
Pro Tip: Don’t judge a vendor by their average purity claim. Ask for the specific lot’s chromatogram before you buy, and compare it against a previous lot from the same vendor if you can get one. Consistency across lots tells you more than any single number.
How to Compare Vendor Prices Without Getting Fooled
Here’s the process that gets you an honest comparison.
- Request the lot-specific COA before you commit. Insist on a document tied to the exact lot you’d receive, including the chromatogram image and mass spectrometry identity confirmation, not a generic COA reused across batches.
- Extract net peptide content, not just purity percentage. A vial labeled “98% pure” by area percent can still carry only 70 to 90% actual peptide mass once you account for counterion weight like TFA, which commonly displaces 10 to 30% of the total mass.
- Convert to price-per-net-mg. Take the quoted price, divide by (vial mg × purity % × net content adjustment), and you get the number that actually lets you compare Vendor A against Vendor B.
- Add shipping, cold chain, and testing fees back in. A cheaper base price with expensive expedited cold-chain shipping can erase the savings entirely.
- Confirm the vendor’s sample verification policy. Ask how often they run independent third-party testing on incoming batches, not just outgoing ones.
What to accept, and what should send you elsewhere:
- Accept: a chromatogram specific to your lot number, MS-confirmed identity, and clear net peptide content stated on the COA.
- Red flag: a COA with no lot number tying it to your actual order.
- Red flag: no chromatogram image, just a summary purity percentage.
- Red flag: marketing language implying dosing guidance, injection instructions, or bundled delivery supplies.
Skipping this math is common, and it’s documented as inconsistent practice across the vendor landscape. Buyers who don’t ask for lot-specific documentation are essentially trusting a label they haven’t verified.
Regulatory Risk in 2026: What Procurement Teams Need to Watch
The FDA’s enforcement approach in 2026 doesn’t rely solely on what a product label says. Agency actions evaluate the “net impression” a vendor creates through marketing, packaging, and bundled products, and that standard has caught out vendors who thought a “research use only” label was enough protection. A recent wave of warning letters made clear that RUO claims don’t hold up when the rest of a vendor’s presentation points to human use.
The FDA’s warning letter to NuScience Peptides illustrates the pattern: bundled bacteriostatic water, dosing calculators, and consumer-facing instructions were cited as evidence of intended human use, regardless of what the product label said. Vendors carrying those features face real disruption risk, and buyers sourcing from them should expect sudden unavailability or price spikes with little warning.
Practical mitigations for your procurement process:
- Require institutional or IRB-level approval documentation before ordering from any new vendor.
- Decline vendors whose marketing includes dosing calculators or human-use language, even if the product page includes an RUO disclaimer.
- Keep a traceable supply chain record for every lot, tied to a specific COA.
Statistic Callout: The hundreds of adverse events the FDA has tied to unapproved GLP-1 products underscore why enforcement isn’t slowing down. Expect continued volatility in that category through the rest of 2026.
Where Peptide Prices Go From Here
Forecasting peptide prices beyond 2026 means tracking three variables rather than predicting a single number: enforcement intensity, synthesis technology adoption, and clinical demand for GLP-1 adjacent research. If enforcement continues at its current pace, expect continued price premiums on flagged categories, with periodic sharp spikes whenever a major vendor gets a warning letter and its competitors absorb the displaced demand.
On the cost-reduction side, wider adoption of automated solid-phase synthesis and improved purification resins should keep pushing baseline manufacturing costs down for stable, non-controversial peptides. That downward pressure won’t offset regulatory premiums on high-scrutiny categories, but it should keep everyday research peptides affordable even as testing and compliance costs rise industry-wide.
The most useful forecasting approach for a procurement team isn’t a price prediction at all. It’s a risk model: track which peptide categories are drawing enforcement attention, watch for vendor consolidation in those categories, and budget for testing costs to keep climbing as third-party verification becomes the market standard rather than a differentiator. Treat any peptide category with rising clinical interest as a candidate for future price volatility, whether or not enforcement has caught up to it yet.
Bulk Orders vs. Small Purchases: Does Scale Actually Save Money
Bulk peptide orders bring down per-mg cost, but the savings are less dramatic than in most commodity manufacturing because testing and compliance costs don’t scale down proportionally. A vendor running HPLC and mass spectrometry confirmation on a 10-gram batch pays nearly the same analytical cost as testing a 100-gram batch, so larger orders spread that fixed cost across more product and lower the per-mg price.
Small-scale buyers, particularly individual researchers or small labs ordering milligram quantities, absorb a disproportionate share of testing and packaging overhead. That’s part of why per-mg prices for small research quantities often run several multiples higher than the same peptide bought in gram quantities from the same manufacturer.
The tradeoff comes at renewal and verification. Bulk buyers who lock in a large order from one lot reduce their per-mg cost but increase their exposure if that lot turns out to have quality issues, since they can’t easily verify a huge batch the way they’d sample-test a smaller one. Smart procurement teams split large orders across verified lots when possible, rather than accepting a single mega-lot purely for the price break. The savings from scale are real, but they only make sense once the lot has passed independent verification.
Raw Material Bottlenecks Are Quietly Pushing Costs Up
Raw material supply constraints are one of the least visible but most persistent cost drivers in peptide manufacturing right now. Specialty resins, protected amino acid derivatives, and certain coupling reagents used in solid-phase synthesis come from a concentrated set of suppliers, and any disruption in that upstream chain ripples through to finished peptide pricing within a quarter or two.
This matters more for longer or more complex peptide sequences, which require more synthesis cycles and therefore consume more of these constrained inputs per finished gram. A shortage that raises reagent costs by even a modest percentage compounds across every coupling step, so complex research peptides feel raw material pressure more acutely than short, simple sequences.
Manufacturers responding to these constraints have a few options: substitute reagents (sometimes at a purity or yield cost), pass the increase directly to buyers, or absorb it temporarily and hope prices normalize. In 2026, most vendors have chosen some blend of passing costs forward and locking in longer-term supplier contracts to stabilize their own input pricing. For buyers, the practical takeaway is that a sudden price increase on a specific peptide isn’t always about that peptide’s demand. It can just as easily trace back to a reagent shortage several steps up the supply chain, which is one more reason to request current lot documentation rather than relying on a vendor’s list price from months earlier.
Automated Synthesis and Purification Are Reshaping the Cost Curve
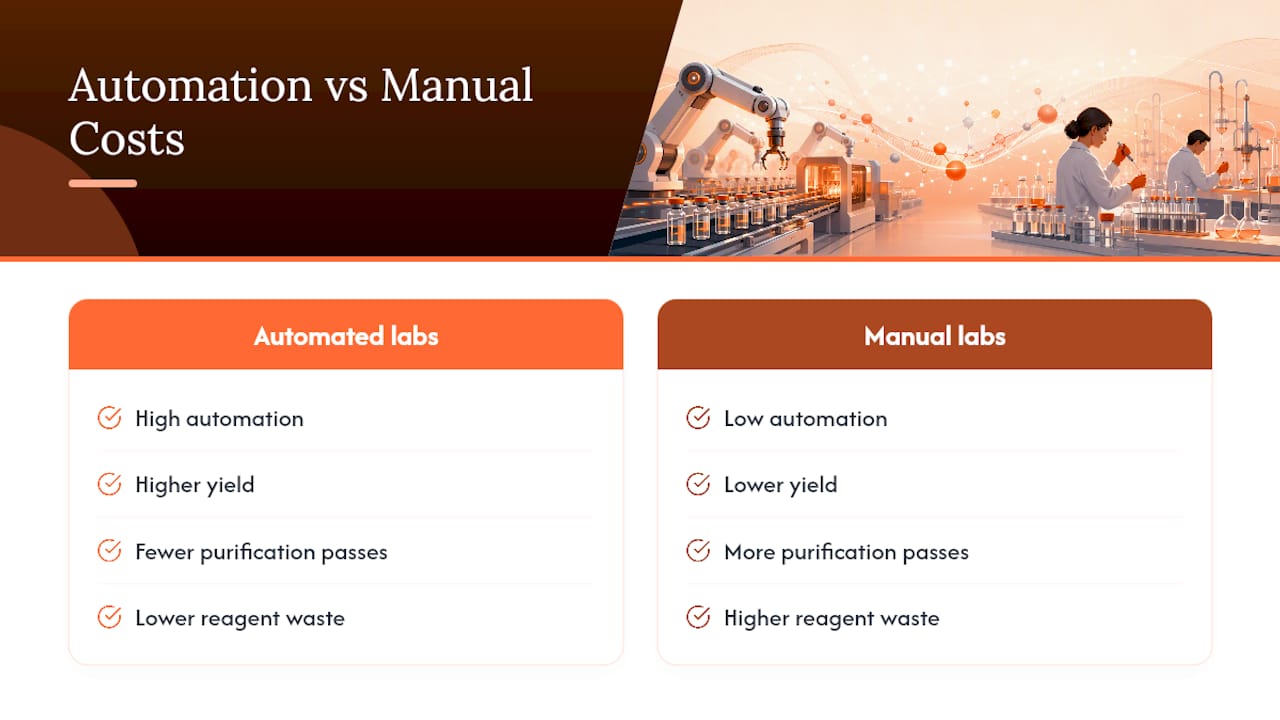
Technology is quietly doing more to lower peptide prices in 2026 than any single market force. Automated solid-phase peptide synthesizers have cut labor time and improved coupling efficiency, which directly raises yield per batch and lowers the effective cost per gram of finished product. Better yield means less wasted reagent, and reagent waste has historically been one of the biggest hidden costs in peptide manufacturing.
Purification technology has moved in parallel. Improved preparative HPLC methods and better resin chemistry let manufacturers hit higher purity thresholds with fewer purification passes, which used to be one of the most expensive and time-consuming steps in the process. Fewer passes means lower solvent cost and faster turnaround, both of which show up in the final quote.
The net effect isn’t uniform across the market. Larger manufacturers who’ve invested in automated synthesis platforms are pulling ahead on cost efficiency, while smaller operations relying on manual or semi-automated processes are increasingly priced out of high-volume categories. That’s part of why price spreads between vendors for the same peptide have actually widened in 2026, even as average costs trend down. A detailed breakdown of synthesis cost structure shows how much of a typical quote traces back to scale, purification passes, and analytical testing rather than raw material alone. For buyers, that widening spread is exactly why price-per-net-mg comparison matters more now than it did even two years ago.
Global Demand and Trade Policy Are Adding a New Layer of Price Risk
Geographic demand isn’t evenly distributed, and that unevenness is starting to show up in vendor pricing. Regions with looser research-peptide regulatory frameworks have seen demand concentrate as buyers in more heavily enforced jurisdictions look for alternative sourcing paths, and that concentration puts upward pressure on prices in the more permissive markets.
Export and import policy adds another variable that most buyers underestimate. Customs delays, new documentation requirements, and shifting classification rules for peptide compounds can add weeks to delivery timelines and, in some cases, add cost through expedited shipping or repackaging to meet import requirements. A peptide that ships smoothly from one country might face additional scrutiny crossing into another, purely based on how that peptide is classified locally.
None of this is peptide-specific volatility. It’s trade friction layered on top of the enforcement and manufacturing pressures already discussed, and it means a price that looks stable domestically can still shift if a vendor’s supply chain crosses a border that just changed its import rules. Buyers sourcing internationally should treat cross-border shipping timelines and customs classification as a real cost variable, not a logistics afterthought, especially for peptide categories already under regulatory attention in one jurisdiction or another.
From Order to Delivery: What Actually Takes Time and Money
A typical research peptide order moves through four stages, and each one adds both time and cost that shows up in the final price. Synthesis itself, using solid-phase methods for most research peptides, usually takes days to a couple of weeks depending on sequence length and complexity, with longer or more complex sequences requiring more coupling cycles and therefore more time and reagent.
Purification follows synthesis and is often the most time-intensive step, since hitting a high purity threshold can require multiple HPLC passes. Analytical testing comes next: running HPLC and LC-MS confirmation to verify identity and quantify impurities adds days and meaningful cost, particularly when a vendor commits to lot-specific testing rather than periodic spot checks.
Finally, COA generation and documentation close out the process, though this step is inconsistent across vendors. Some generate a fresh COA for every lot; others reuse older documentation, which is exactly the shortcut buyers need to watch for. The full cycle from order to shipment typically runs anywhere from one to several weeks depending on sequence complexity and how rigorously the vendor tests each batch. Buyers who need faster turnaround should ask upfront whether the vendor tests every lot or works from a rotating testing schedule, since that answer affects both price and how confident you can be in what you actually receive.
Peptide Vendor Reviews’s Take on Why Lab Data Changes the Price Conversation
Comparing peptide prices without independent lab verification is comparing numbers that don’t mean the same thing. A price is only meaningful once it’s tied to confirmed net peptide content and a lot-specific COA with real chromatogram and mass spec data behind it, and most vendor marketing simply doesn’t give buyers that.
That’s the gap Peptide Vendor Reviews’s data set is built to close, tracking real-time pricing and independent HPLC and mass spectrometry results across more than 200 vendors. Buyers who anchor decisions to lab-verified purity rather than list price consistently avoid the worst outcomes: overpaying for underdosed material or, worse, running research on a compound that isn’t what the label claims.
— Ross
How to Act Now: Normalize Prices and Verify Purity Before You Buy
Every calculation in this guide, price-per-net-mg, lot-specific COA review, counterion adjustment, gets faster when you’re not starting from a blank vendor list. This platform offers an alternative to blind vendor trust: independent HPLC and mass spectrometry results, real-time pricing across numerous verified vendors, and published failures alongside the passes, while not selling peptides itself and maintaining impartial vendor rankings.
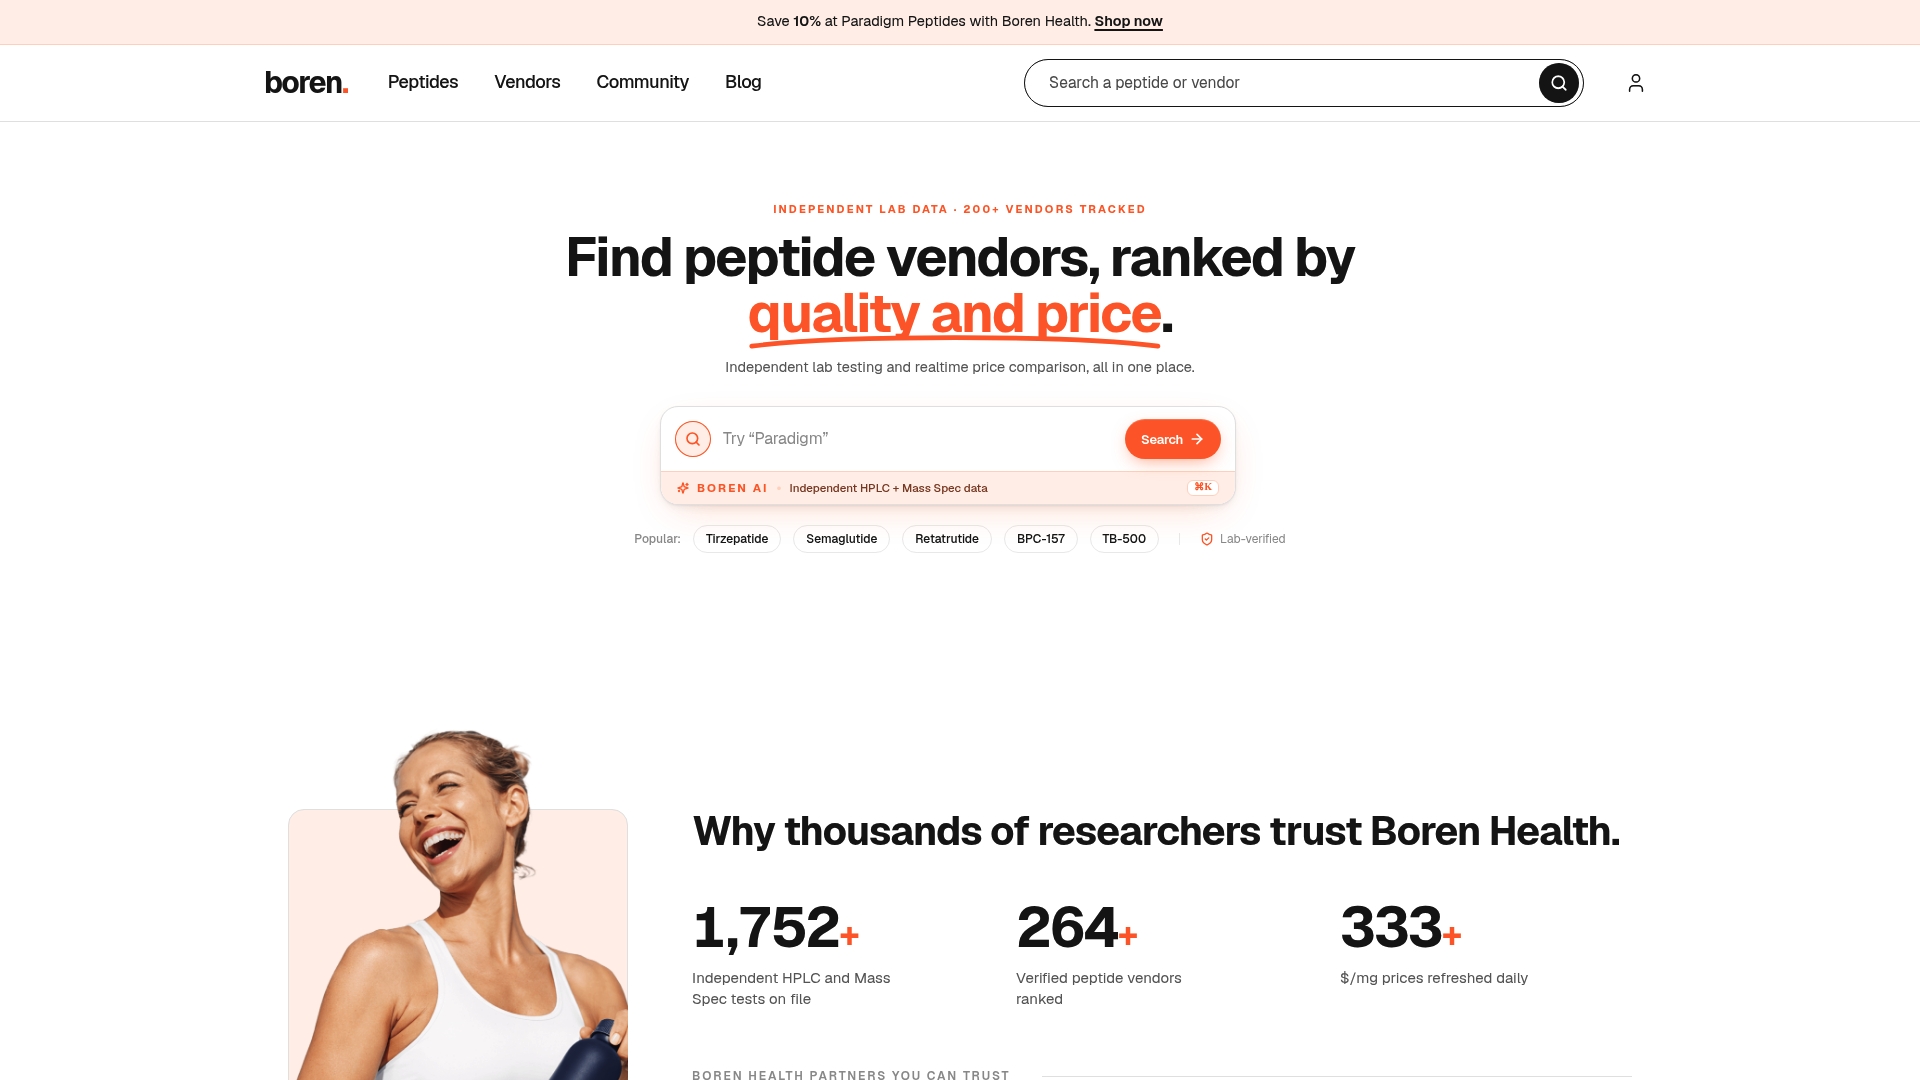
If you’re comparing quotes for GLP-1 class or investigational peptides, start with the vendor comparison pages to see current lab-verified purity rankings side by side. Need your own sample checked before you commit to a bulk order? Request independent third-party testing on your specific lot rather than relying on a vendor’s own COA. And if you’re building an RFQ for your institution, pull the purity and pricing data from Peptide Vendor Reviews’s peptide vendor ratings and require the same lot-specific documentation standard from every vendor you’re evaluating. Vendors interested in listing can review plan details for the Standard, Premium, and Enterprise tiers.
This article is general information, not a substitute for advice from a qualified doctor. Consult a qualified healthcare professional about your own circumstances before acting on anything here.
Sources
- RUO-ined: Five Peptide Vendors Learn That ‘Research Use Only’ Is Not a Legal Strategy | ArentFox Schiff
- Building parity between brand and generic peptide products: Regulatory and scientific considerations for quality of synthetic peptides. International Journal of Pharmaceutics
FAQ
Are Peptide Prices Going Up or Down in 2026?
It depends on the category. GLP-1 class and enforcement-flagged peptides are seeing price spikes tied to scarcity, while stable, low-scrutiny research peptides are trending flat to lower as automated synthesis cuts manufacturing costs.
How Do I Calculate Price Per Net Peptide Mg?
Divide the vial price by the vial’s milligram content adjusted for both purity percentage and counterion weight, since TFA and other salts can account for 10 to 30% of total mass. Skipping the counterion adjustment is the most common way buyers misjudge true cost.
What Should a Lot-Specific COA Include?
A proper COA includes a chromatogram image, mass spectrometry identity confirmation, and net peptide content tied to that exact lot number, not a generic document reused across batches. Reused or chromatogram-free COAs are a documented red flag in vendor evaluation.
Does Peptide Vendor Reviews Sell Peptides Directly?
No. Peptide Vendor Reviews operates as an independent comparison platform, providing lab-verified pricing and purity data across more than 200 vendors without selling peptides itself.
Why Are Some Peptide Vendors Suddenly Raising Prices?
Often it traces to regulatory enforcement creating short-term scarcity, not a change in raw material cost. A surge in FDA warning letters tends to push remaining vendors in that category to raise prices as supply tightens.